The Analytics View allows selected users to view insights into achievement tracking and utilisation of the Proactive Monitoring Tool, along with the rules enabled at your practice. We recommend using this feature to explore general trends over time, helping you stay up to date with your monitoring targets.
This is a new feature, which will eventually replace the Analytics View in the desktop Proactive Monitoring Tool.
Jump to:
How do I access Analytics in User Management Portal?
What dashboards are available?
Why do you have a new dashboard, and why has it moved?
How do I access Analytics in User Management Portal?
Ensure the relevant user has both Admin and Analytics permissions selected in the Team section in the User Management Portal.
![]()
Navigating the Analytics View
There's a lot happening here, but we'll guide you step by step!
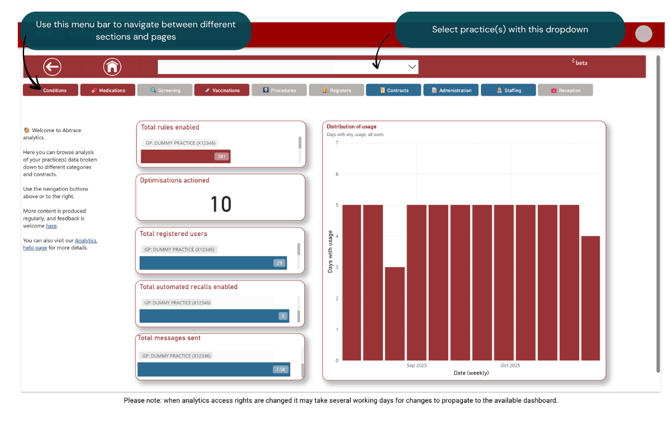 When you select Analytics, the home page loads automatically. From here, you can navigate to different sections and dashboard pages using the horizontal menu bar.
Here's a breakdown of what you'll see:
- Red - clinical dashboards
- Blue - non-clinical dashboards (such as Contracts or Utilisation)
- Grey - dshboards not yet available
💡Some areas may overlap. For example, Diabetes has its own dedicated dashboard under Conditions > Diabetes. Diabetes-related QOF rules are also covered under Contracts > QOF.
What does the home page show?
The home page displays summary charts by practice, including:
- Number of rules enabled
- Optimisation recommendations which have been actioned
- Registered users
- Total automated recalls enabled
- Total messages sent via Abtrace
- Days where at least one user at the practice has used Abtrace
What dashboards are available?
The Analytics View is divided into 10 sections, each containing specific dashboards. Sections marked as coming soon are not yet available:
Conditions
Medications
Screening (coming soon)
Vaccination
Procedures (coming soon)
Registers (coming soon)
Contracts
Administration
Staffing
Reception (coming soon)
Need help getting started?
Every practice operates differently with different priorities, but here are some useful starting points:
-
Contracts > Casefinders - overview of Optimisation recommendations actioned and pending
-
Staffing > Utilisation, user level - see which Abtrace users are most active
-
Contracts > QOF - review performance on different rules and domains
-
Medications > All medications - monitor performance for different medications
Why do you have a new dashboard, and why has it moved?
Our new dashboard is considerably more comprehensive, with additional dashboards and pages available.
We found that users of Analytics are often thesame users who are interacting with existing features of the Proactive Monitoring Tool, including Admin users who manage Automated Recalls. By moving this to the User Management Portal, you can easily access this information in one place.