![abtrace-logo-colour@2x-3.png]](https://help.abtrace.co/hs-fs/hubfs/abtrace-logo-colour@2x-3.png?width=124&height=60&name=abtrace-logo-colour@2x-3.png)
Your Gateway Status and date of last update appears in the top right corner of the Proactive Monitoring Tool. It shows the status of the data connection between the pipeline setup PC and the Tool. If data is more than 48 hours old, there is a problem with the connection and an alert will appear.
Know what you're looking for? You can jump to:
What each gateway status means
Common causes of a broken pipeline
What each Gateway Status means
A quick look at what the colour of your Gateway Status in the Proactive Monitoring Tool means. You can hover over the alert at any time for more details. If your status shows a disconnection, follow these steps to reconnect and fix a broken pipeline.
Green - connected
Data is flowing normally. No action needed.
Grey - refresh needed
Click into the Population tab. This usually triggers the status to update to green.
Amber - disconnection detected (day 2-6)
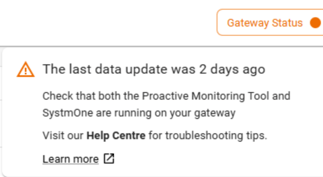
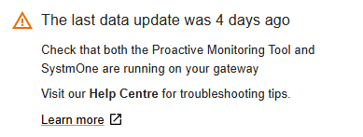
Your Gateway Status will show amber from day 2 of a disconnection through to day 6, with the alert updating to reflect how long it's been since the last upload:
-
After 2 days: you'll see a warning that the last data update was 2 days ago.
-
After 4 days: the warning updates to show it's been 4 days since the last upload and the disconnection is ongoing.
Red - access locked after 7 days
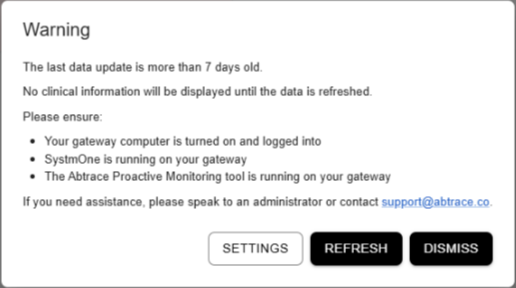
If data has not been refreshed for more than 7 days, clinical information will be hidden to prevent outdated recommendations. Follow the reconnect steps to restore access.
How to reconnect the pipeline
To reconnect the pipeline, you need to ensure the following:
- Gateway PC is turned on and logged into
- SystmOne is logged into
- Proactive Monitoring Tool is running on the same Gateway PC
🕑Note: Data is processed overnight. Once reconnected, the warning will clear and access to the Proactive Monitoring Tool will typically be restored the following day.
Common causes of a broken pipeline
This is usually caused by one of the following:
- Setup PC is being logged into by different users
- Setup PC is turned off
- Setup PC has been changed or modified by IT
- SystmOne (TPP) is not set up to use high memory
- Proactive Monitoring Tool is not running
- Proactive Monitoring Tool has not updated
- Proactive Monitoring Tool has crashed
Setup PC is being logged into by different users
For the Abtrace Proactive Monitoring tool to operate correctly, the Gateway computer should only use one windows user (a generic user).
If multiple Windows users log in to the Gateway computer, the Proactive Monitoring tool might not be able to send the data across to Abtrace.
Setup PC is off
For the Proactive Monitoring tool to work correctly, the Gateway computer should stay turned on.
Please make sure not to turn the Gateway computer off.
Setup PC has been changed / modified by IT
Periodically, the IT department might go through an upgrade/update/maintenance on the Gateway computer. When this happens, it is often the case that they forget to configure the Abtrace Proactive Monitoring tool to transfer the data.
If you know of any scheduled maintenance planned on the Gateway computer, please get in touch by submitting a ticket or contacting our team at support@abtrace.co. We'd be happy to review the settings together.
TPP is not setup to use high memory
For SystemOne to be able to handle the daily extracts, the Gateway shortcut (usually on the desktop), needs to be configured to run on high memory usage.
To do this:
- find the Gateway SystmOne shortcut on your desktop
- right click on it > properties
- change the
targetfield to:C:\apps\Tpp\rungenps.bat -Xmx1024m -Xskipmemorycheck
Doing so might need admin rights. Please get in touch with your practice manager or IT department.
Proactive Monitoring Tool is not running
To check whether the Abtrace Proactive Monitoring tool is running, check the bottom right of the screen (on the Gateway), next to the time.
Click on the arrow pointing up and look for the Red Abtrace Icon.
Double click on it to launch the app.
Proactive Monitoring Tool is not updated
The update of the software should be automatic. In some cases though, the app fails to update itself.
To force the update of the Abtrace Proactive Monitoring tool, follow these steps:
- launch the Abtrace Proactive Monitoring tool
- login
- click on your initials (top right) > settings
- click on the
Check for updatesbutton.
If this doesn't work, head over to the portal, download the software again and re-install it.
Proactive Monitoring Tool has crashed
To check whether the Abtrace Proactive Monitoring tool is running, check the bottom right of the screen (on the Gateway), next to the time.
Click on the arrow pointing up and look for the Red Abtrace Icon.
Double click on it to launch the app.
🕑 Note: Data is processed overnight. Once reconnected, the warning will clear and access to the Proactive Monitoring Tool will typically be restored the following day.
Still not working?
If completing these steps does not resolve the issue, please submit a Support Ticket via our Web App. Alternatively, you can email us at support@abtrace.co.