The Executions tab shows a log of every time this recall has run, with a breakdown of each one - including how many patients were contacted and by which method.
Jump to: How to access · What you'll see · Execution report
🔑 How to Access Your Execution Log
- Log in to the User Management Portal
- Select your practice name
- From the left-hand navigation menu, choose Automated Recall
- Select the recall you want to review
- Click Executions
📊 What You'll See
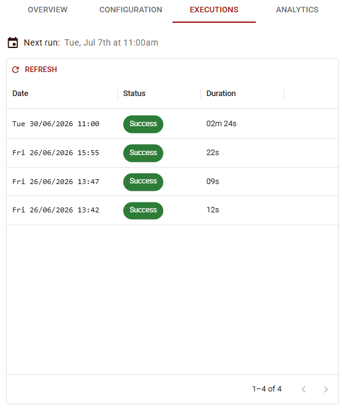
Next run - the date and time this recall is next scheduled based on your configuration.
Refresh - updates the list with the latest execution information.
A table of all executions showing:
- Date - when it took place
- Status - Success or Failed
- Duration - how long it took to run
ℹ️ Note: A "Next run" date will still show even when a recall is disabled. The toggle next to your recall name will confirm whether it's currently active.
📋Execution report
Click into an execution to view its report, which includes:
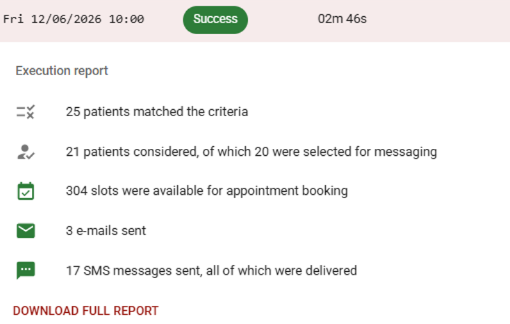
- Patients matched the criteria - the total number of patients who met the recall's filters at that time
- Patients considered, of which X were selected for messaging - how many were reviewed vs. selected to be contacted (some may be excluded, for example due to an existing appointment or recall constraints)
- Slots available for appointment booking - the number of open appointment slots at that time, where a booking link is included
- E-mails sent - the number sent
- SMS messages sent, including how many were successfully delivered
Click Download Full Report to export the complete patient-level breakdown.
⚠️ Failed executions: If a run shows as Failed, click the field to see more detail.