💡 Check out our Analytics dashboards in User Management Portal here, and read the help article here) (beta).
The Analytics feature offers selected users to view insights into achievement tracking and utilisation of the Proactive Monitoring Tool, and the rules which are enabled at the practice. We suggest this feature is most helpful when looking at general trends over time, to help you keep up to date with all your monitoring and targets.
Only users with the Analytics feature enabled can see the following dashboards - learn how to enable Analytics for a user here.
Contents
1. Overdue Monitoring tracking
2. Achievement by Financial Year (year on year analysis)
3. Achievement by Financial Year (practice analysis)
4. Utilisation (by staff group)
1. Overdue Monitoring tracking

The Overdue Monitoring dashboard shows users how the practice is performing on selected indicators, over time. These charts track how many patients are overdue their monitoring - i.e., how many patients are red, for a given indicator, over time. The chart on the left shows the percentage of patients who are overdue, and the chart on the right shows the number of patients who are overdue.
The dropdown slicers at the top of the dashboard allow the user to select between indicators and organisation(s) (if applicable).
Indicators which are usually measured over a single financial year (e.g., QOF indicators) are explored separately, in dashboards 2. Achievement by Financial Year (year on year) and 3. Achievement by Financial Year (practice analysis).

2. Achievement by Financial Year (year-on-year analysis)
The Achievement by Financial Year (year-on-year analysis) dashboard shows users how the practice is performing on indicators which are measured each financial year (e.g., QOF-indicators).
These charts will show a practice's achievement from April to March, by each financial year - i.e., how many patients are green, for a given indicator, over time. The chart on the left shows the percentage of achievement, and the chart on the right shows the number of patients who have achieved the target.
The counter at the top right displays how many patients still need to be reviewed or are not at target - i.e., the number of patients who are orange and red. The button just below this provides direct access to the Population View, with the relevant filters pre-populated, enabling users to instantly see these patients. From here, patients can be sent an SMS or email by either single or bulk messages; setting up automating messaging; or even by creating your own recall.
The dropdown slicers at the top of the dashboard allow the user to select between indicators; organisation(s) (if applicable); and the financial years of interest. Multiple financial years can be stacked, allowing comparison of performance across years.

This can help your practice keep on top of its monitoring, plan capacity and avoid any unnecessary rush at the end of the year!
Note: You will only see the option to view previous financial years, if you were an Abtrace customer at the time.
3. Achievement by Financial Year (practice analysis)

The Achievement by Financial Year (practice analysis) dashboard shows users how the practice is performing on indicators which are measured each financial year (e.g., QOF-indicators).
It is similar to 2. Achievement by Financial Year (year on year analysis); however, this dashboard allows multi-practice comparisons.
In this view, you can only see data for one financial year at a time.
Multiple practices will only be visible to users who have access across multiple practices and have the Analytics feature enabled at all of these practices.

4. Utilisation (staff group)

The Utilisation dashboard gives an overview of usage of the Proactive Monitoring Tool at your practice(s).
There are two charts, which show:
- Proportion of usage, by staff group, over time (this is based on the the Role defined by the user when creating their account)
- Proportion of usage, by staff group, based on the timeframe selected in the top right slider

5. Utilisation (user level)
This gives an overview of utilisation of the Proactive Monitoring Tool, but at user level, including:
- Unique registered users: the number of Abtrace Proactive Monitoring Tool users registered, at your practice(s)
- Unique active users (latest week): the number of users who have been active on the Abtrace Proactive Monitoring Tool (based on the latest week of data we have for the practice - there can be a lag of around one week this)
- Utilisation by user: number of days (in the selected time period) individual users have been active on the Proactive Monitoring Tool
- Distribution of usage: number of days (in the selected time period) individual users have been active on the Proactive Monitoring Tool, over time. This may be useful to see if the number of days a user has been using the tool has been increasing or decreasing over time, and compared to other users in the practice.

There are three filters along the top:
- Organisation(s): for users who may have access to more than one practice, the practice of interest can be selected here.
- Date: the time period of interest can be selected here. This will adjust all the visuals, except unique registered users.
- Staff group: based on information the user input when first registering an account with Abtrace.
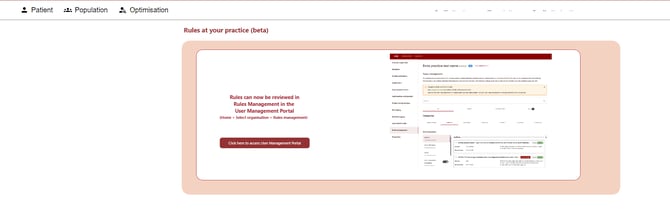
6. Rules at your practice
Our Rules dashboard has been retired - review and modify the rules enabled for your practice in Rules Management in the User Management Portal (learn more here)
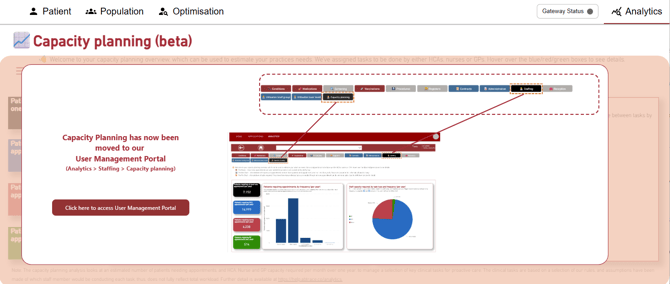
7. Capacity planning
Our Capacity Planning dashboard has migrated to our Analytics dashboards in User Management Portal (learn more here)
📆 Once a practice has configured which rules govern their proactive care, Abtrace is able to calculate for each patient how often they need each of an array of tasks (biometrics, blood tests, vaccinations, reviews…).
📌 Making some assumptions about which staff members can do which tasks, allows us to know which tasks can be done together in the same appointment, and which cannot.
|
Staff group |
Tasks we have assigned |
|---|---|
|
Healthcare assistants (HCA) |
Biometrics Blood tests ECG Foot check Urine tests Vaccines (influenza) |
|
Nurse |
Cervical screening Nurse reviews (diabetes (Enhanced LTC), asthma and COPD reviews) |
|
GP |
GP reviews (dementia; heart failure; learning disability; mental health (QOF) care plans/reviews |
🧪 A patient who needs blood tests twice a year (HCA), biometrics once a year (HCA), a cervical screen once every 3 years (nurse) and a mental health review once a year (GP) will therefore need 2 x HCA, 1 x nurse and 1 x GP appointment per year.
💡 We’re able to aggregate this for all patients to project overall how many appointments of each type are needed for a practice’s proactive care.

➕ You will find that if you turn on more rules (for example around blood test monitoring) your total number of required HCA appointments may increase.
🙌 We appreciate every practice will have slightly different ways of working, so whilst our groupings may not exactly match how your practice works, we hope it will still give a helpful estimation. We also love hearing your feedback, so feel free to get in touch at support@abtrace.co
8. Messaging
The Messaging dashboard will show a summary of the number of messages (SMS and email) sent using Abtrace messaging features (single, bulk and automated) and number of appointments successfully booked by patients using Abtrace self-booking links.

The first chart shows the number of messages sent, over time, split into the following categories:
-
Single SMS
-
Single email
-
Bulk SMS - SMS messages sent by bulk messaging, in Population View
-
Bulk email - email messages sent by bulk messaging, in Population View
-
Automated SMS - SMS messages sent by automated recalls
-
Automated email - email messages sent by automated recalls
The second chart shows the number of appointments which have been successfully booked by patients, using Abtrace self-booking links, over time.